Data
Visualizations and graphics built with HTML/CSS/JS/d3/ai2html/etc.
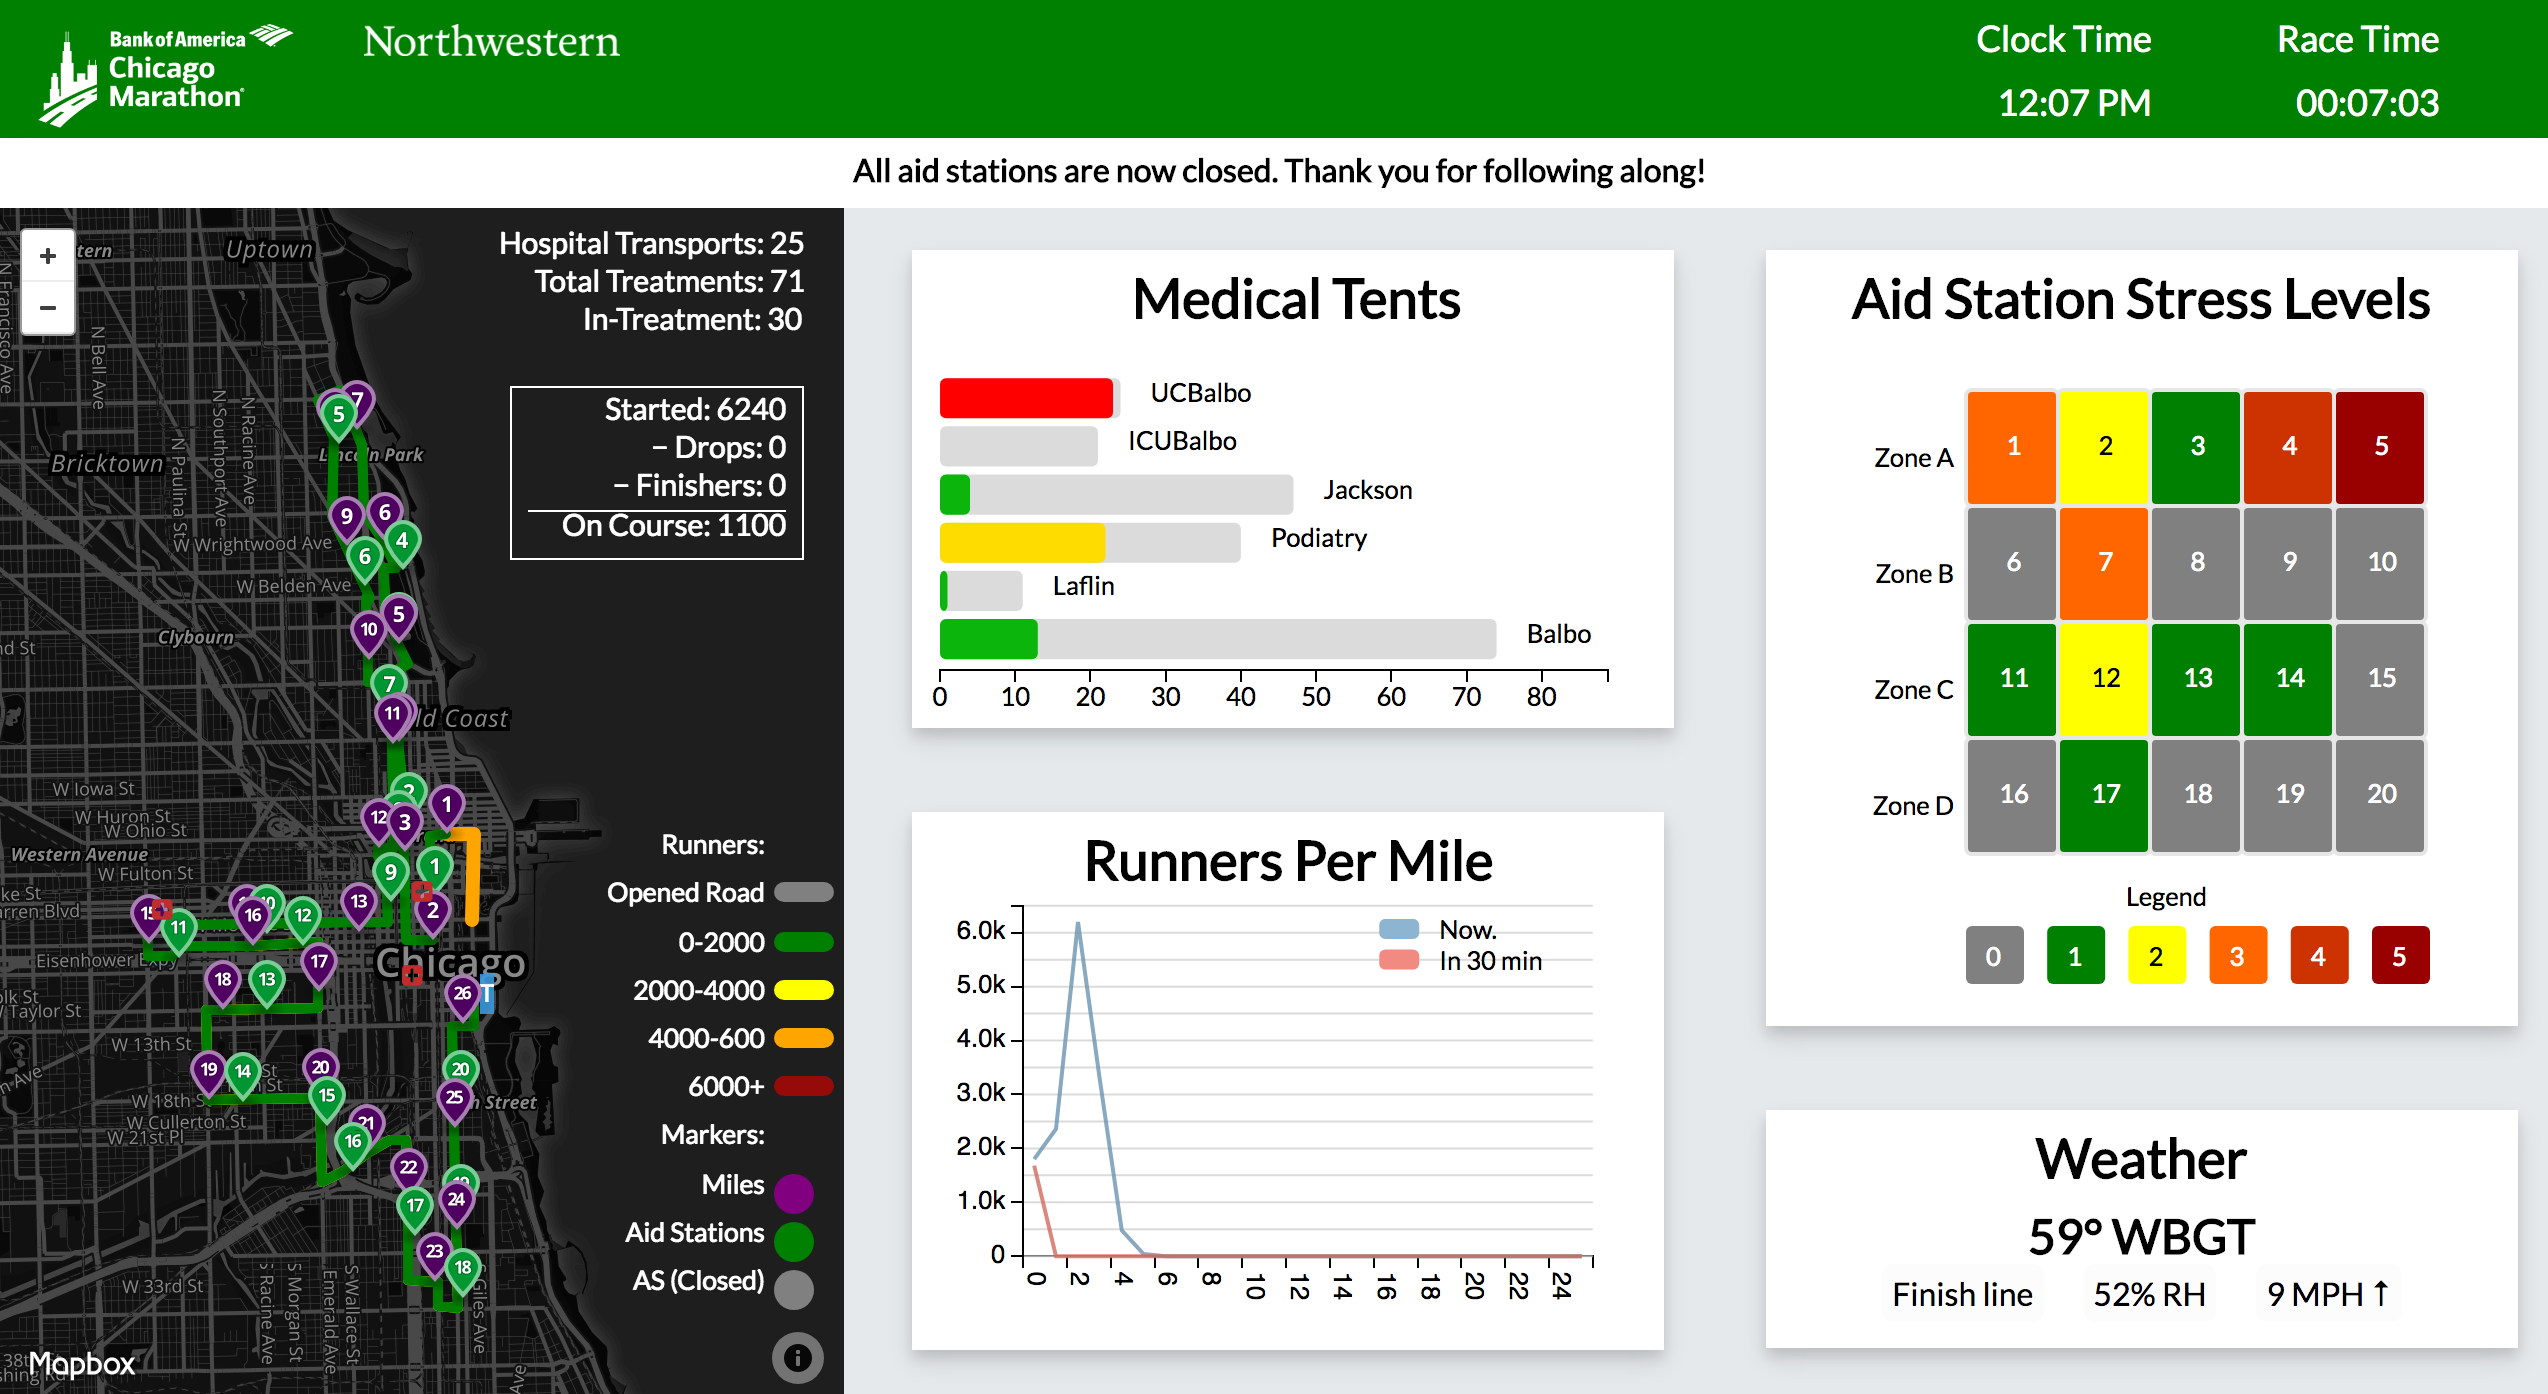
Chicago Marathon Visualization
Research Worked with a team of researchers to develop a data visualization system for the Chicago and Houston Marathons using the LAMP stack. I was involved with the design and development of the entire system, which features race simulations from previous years, real-time data incorporation (I built a separate Selenium scraper for the Houston Marathon), and the visualization and display that would be shown in forward command on race day. This research project is still ongoing.
NEWSounds
Side Project NEWSounds is a data sonification experiment that imagines what the news sounds like. Using features including random seed generation, sentiment analysis, and topic categorization, I mapped headlines from the New York Times into music and an accompanying visual display.
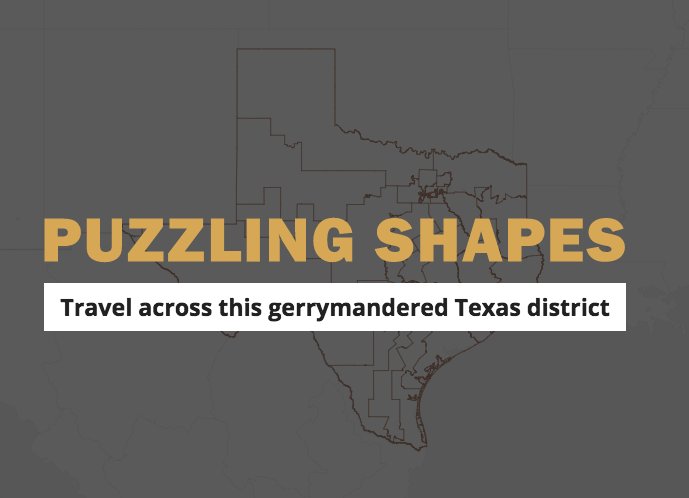
Texas Redistricting
Texas Tribune I worked with reporters to design and produce an interactive visualization, which demonstrated how Texas's 35th Congressional District violated the Voting Rights Act.
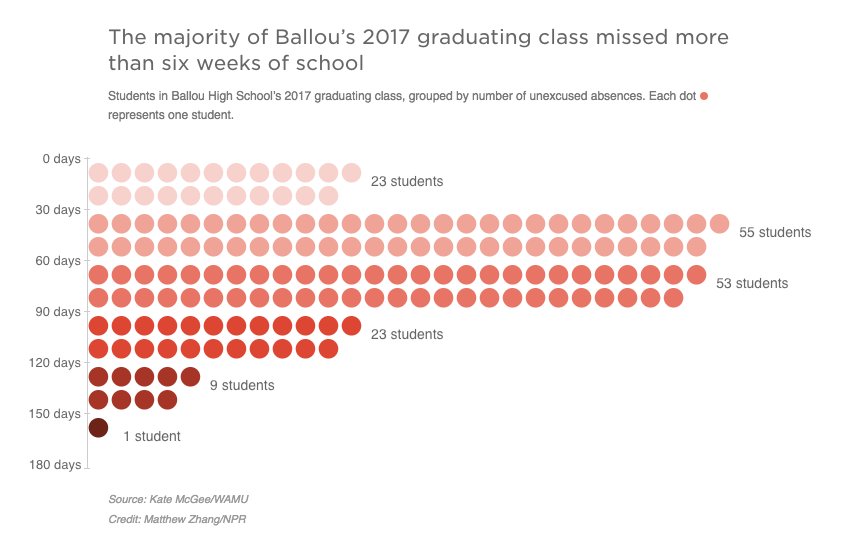
Ballou Graduation Rates
NPR Visualized the overinflated graduation rates in Ballou High School for a joint WAMU/NPR Ed investigative story.
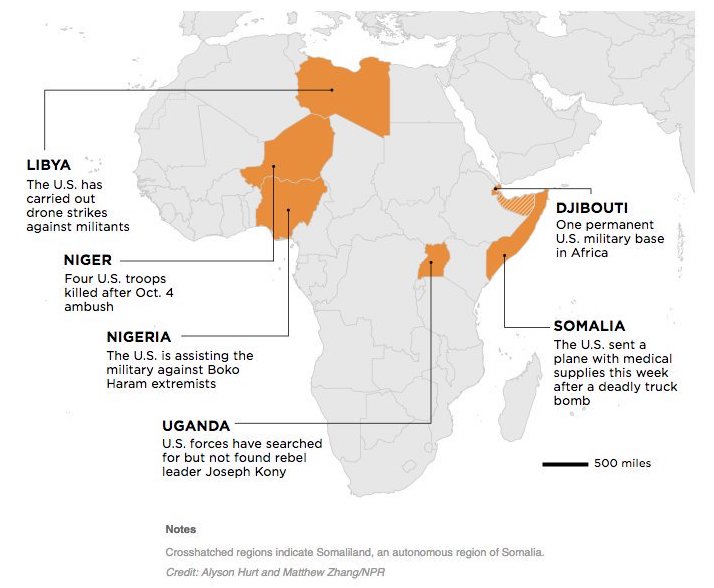
U.S. Military Involvement in Africa
NPR Mapped and annotated U.S. military invovlement in Africa using ai2html.
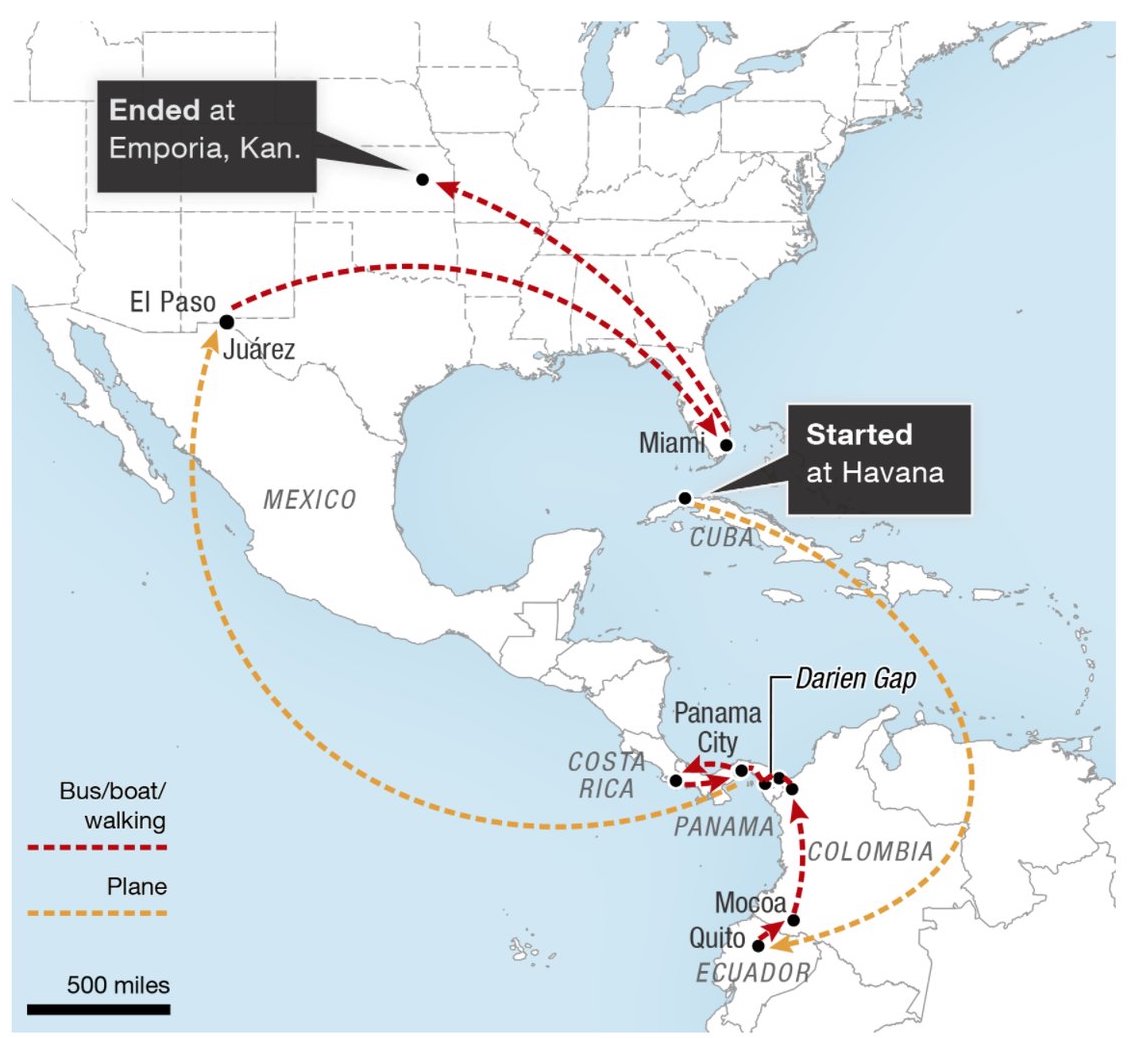
Cuban Immigrant's Journey
NPR Mapped and annotated a Cuban immigrant's arduous struggle to make it to the United States using ai2html.
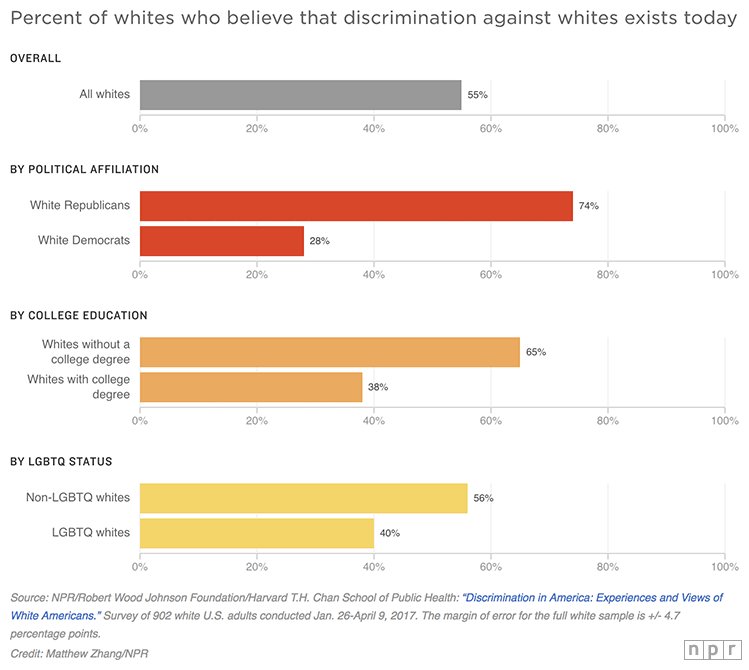
Discrimination in America Polls
NPR Visualized an NPR/Harvard poll that revealed a majority of white Americans believe that discrimination against whites occur today.
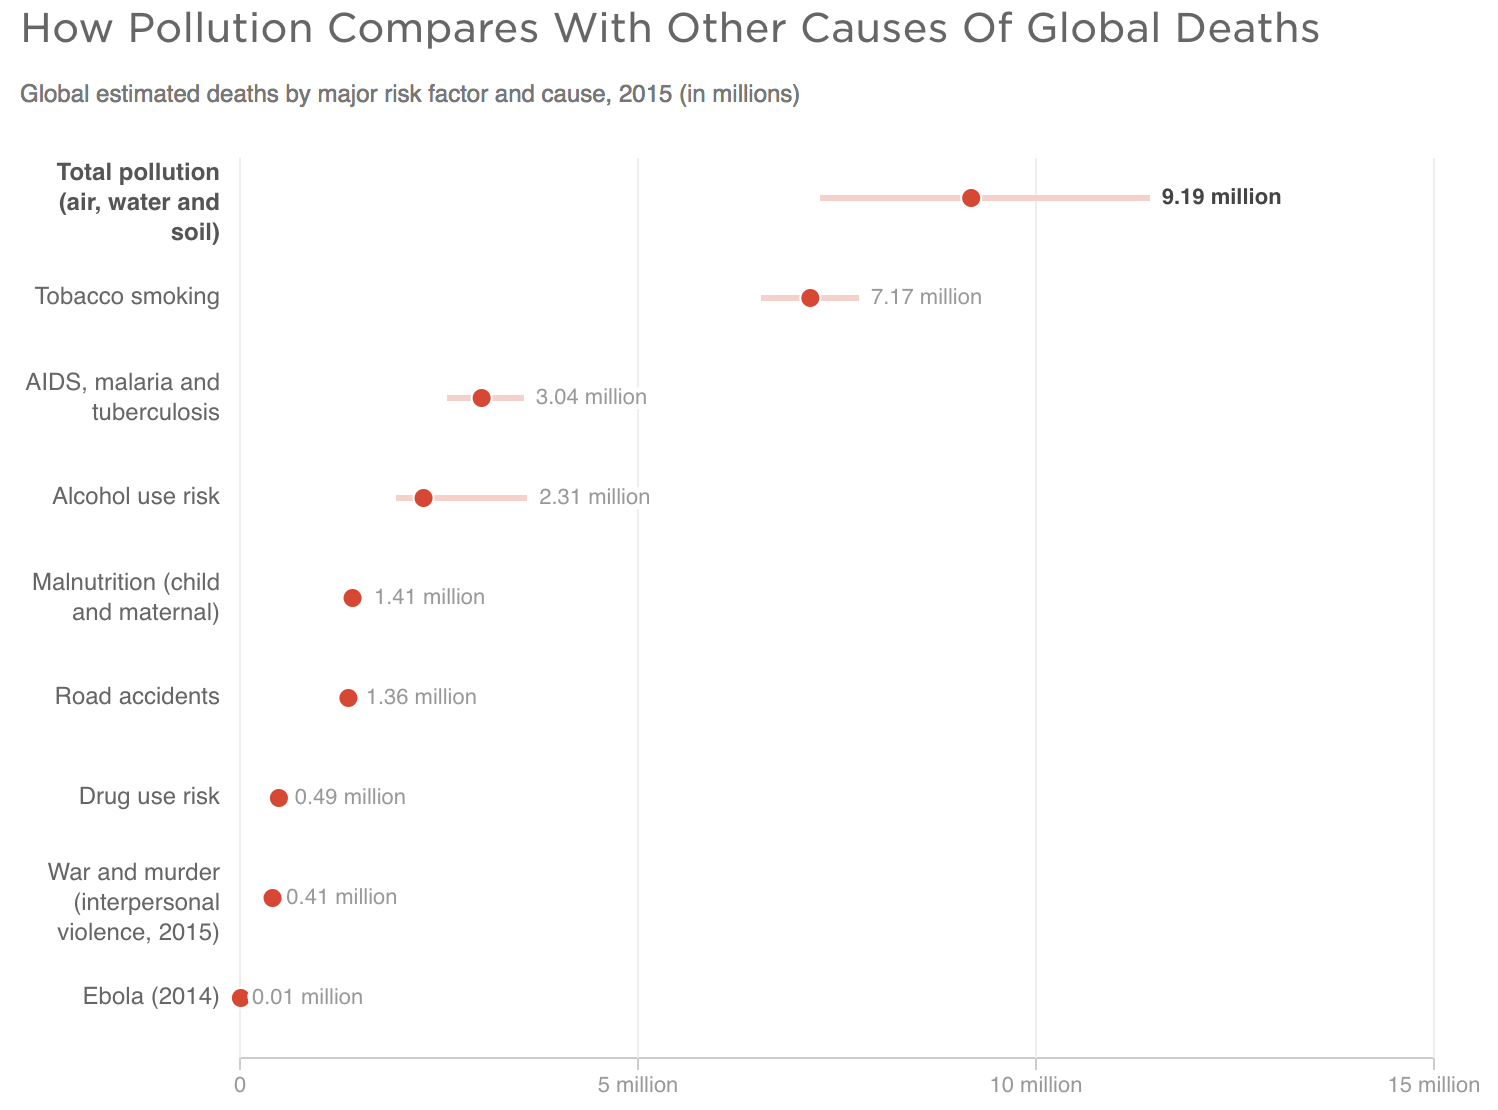
Pollution Deaths
NPR Used a dot chart to visualize pollution deaths in comparison with other major causes of death.
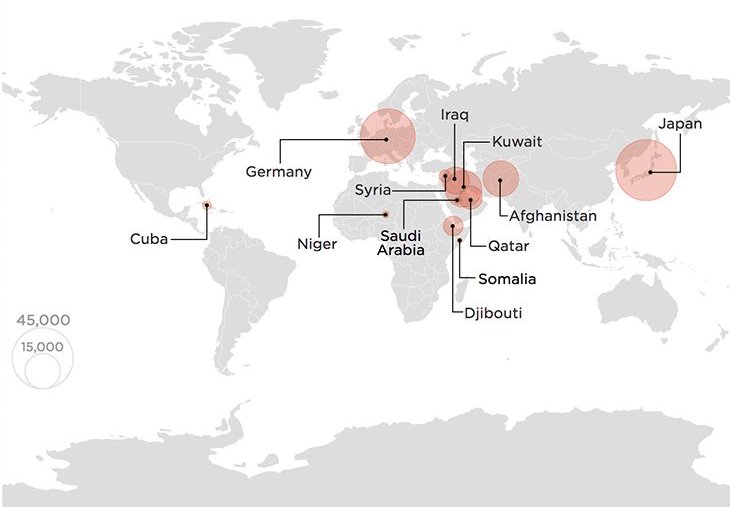
Overseas U.S. Troop Deployment
NPR Since President Trump came into office, U.S. troop numbers have been edging up in the three countries where the U.S. is most deeply involved in fighting — Syria, Iraq and Afghanistan. In addition to visualizing this with d3 and annotating with ai2html, I also cleaned data from the Department of Defense using Python scripts.
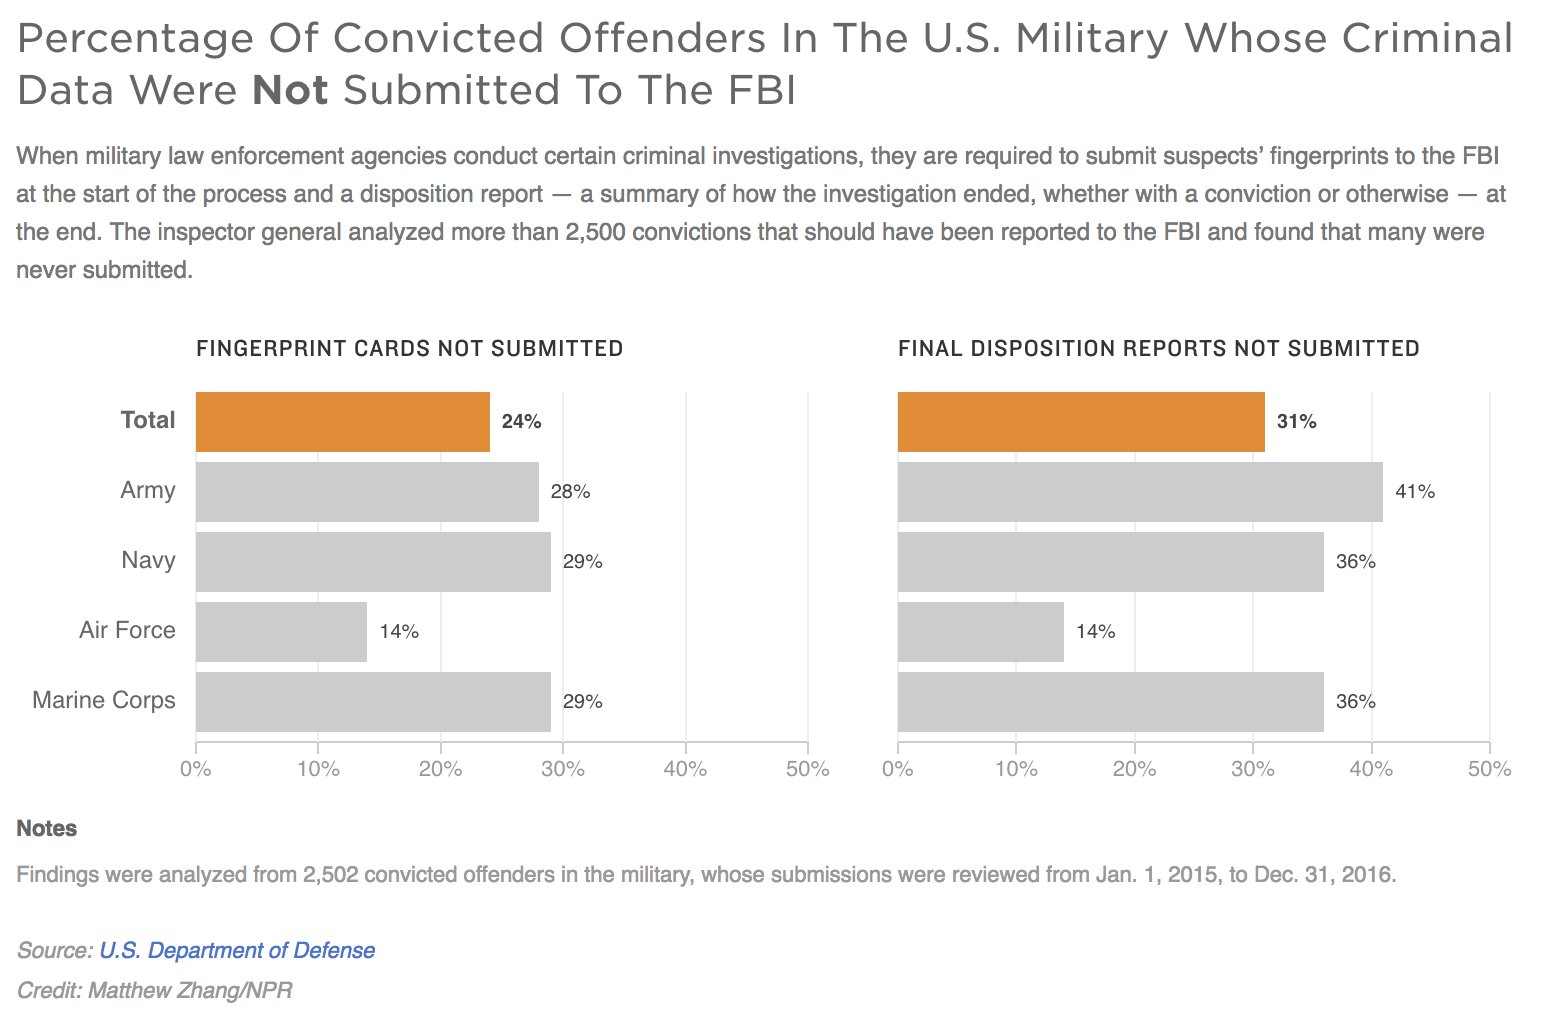
Military Crime
NPR Visualizes reports showing that the military failed to provide a large percentage of criminal history records to the FBI - a systemic problem that allowed the gunman in the November 2017 Texas shooting to pass background checks.
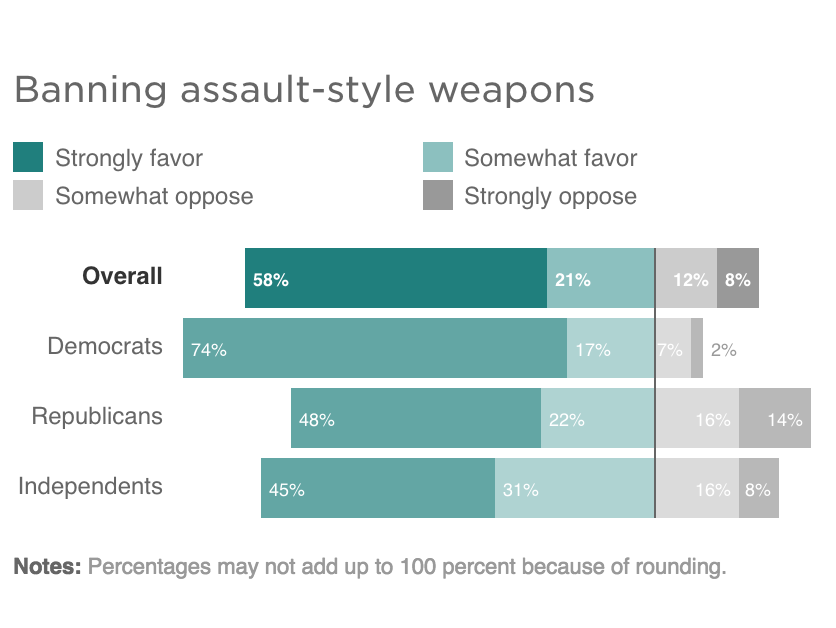
Gun Restriction Poll
NPR Used a diverging bar chart to visualize a NPR/Ipsos poll on gun restrictions.
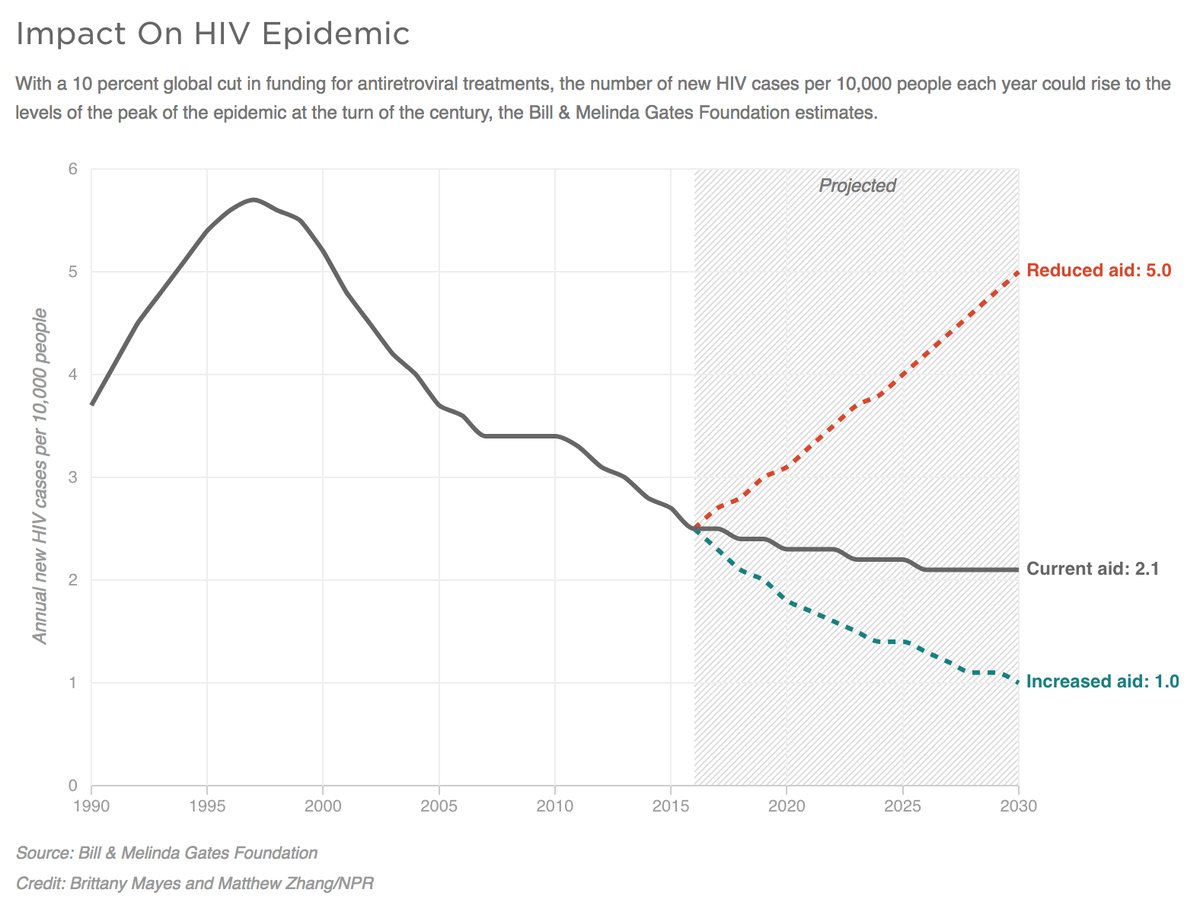
Disease Projections
NPR Visualized disease projection rates using analysis from the Gates Foundation.
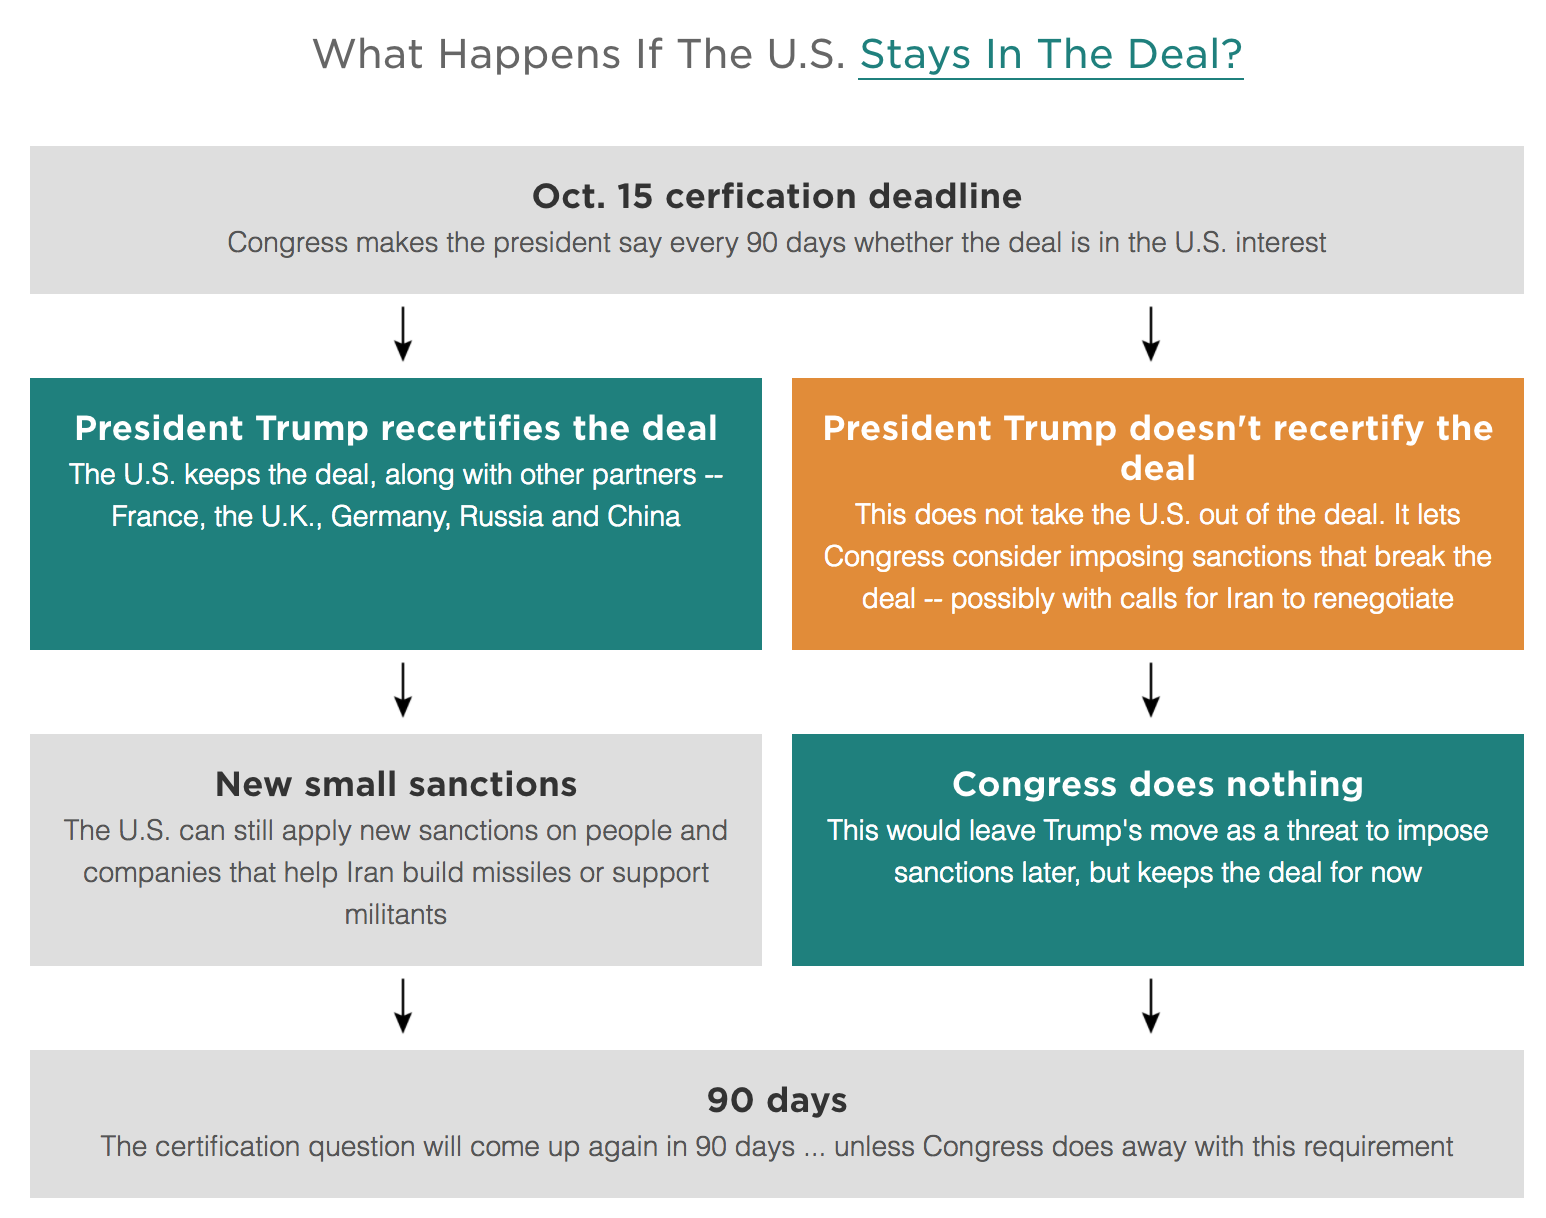
Iran Recertification
NPR Worked with a reporter to design flows that would accurately describe different scenarios upon Trump's recertification decision.
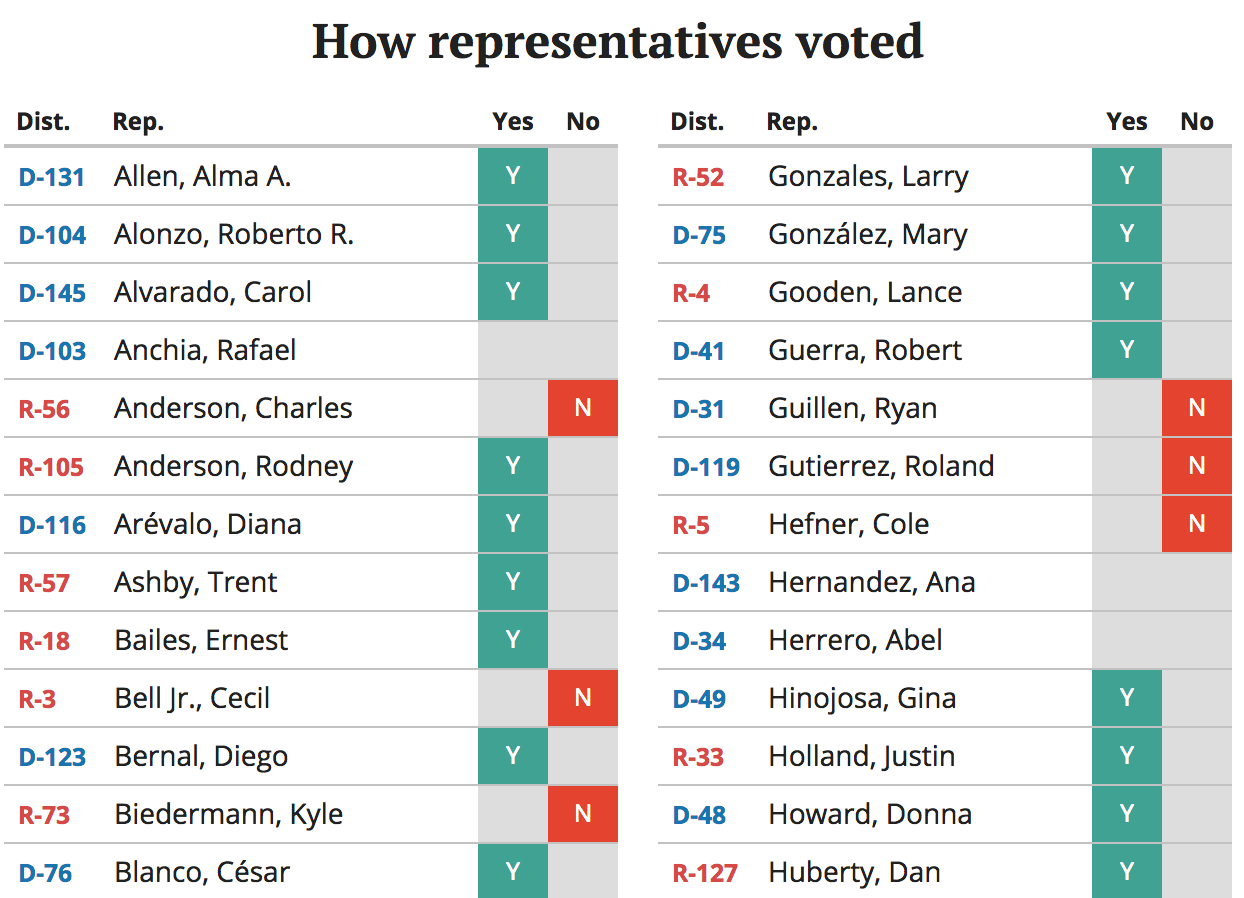
Vote Tracker
Texas Tribune I helped create an app that allowed reporters to easily track and visualize votes on Texas legislation from a Google Spreadsheet.
Special Session Cost
Texas Tribune Worked with a community reporter to research and visualize the costs of the 2017 Texas special legislative session.
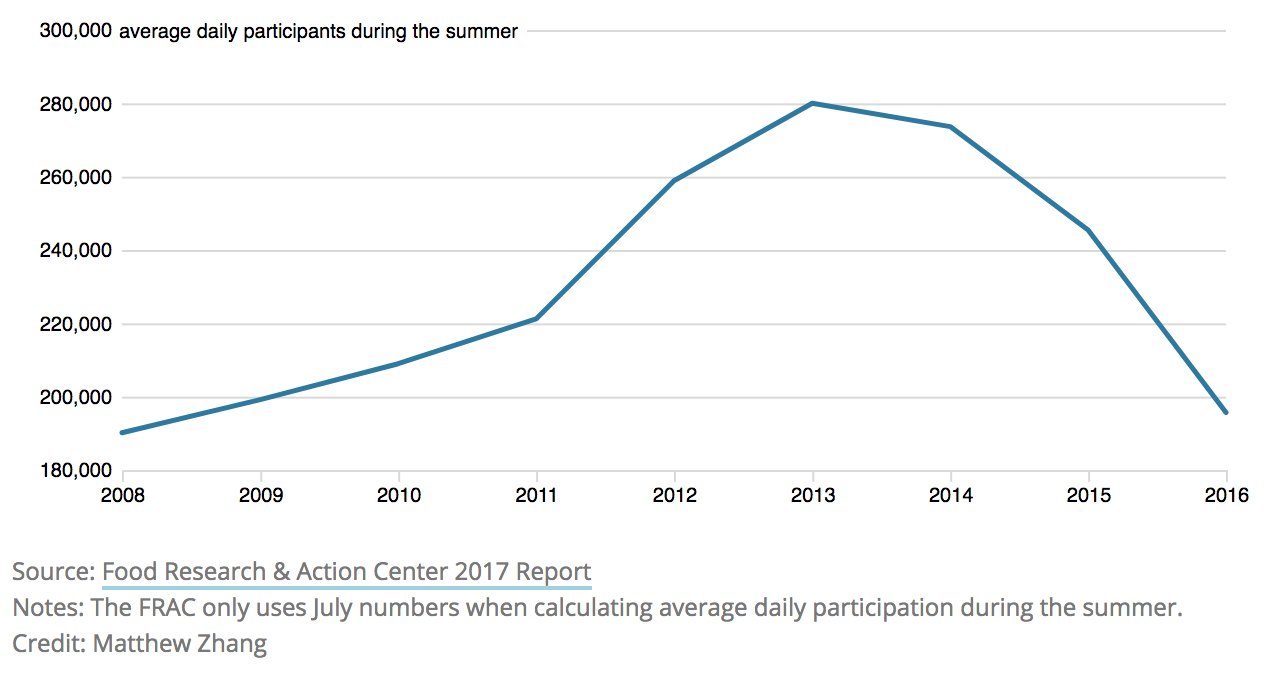
Summer Meals
Texas Tribune Wrote a Python script to analyze education data and track Texas children's participation in summer meal programs. I then visualized the results with d3.
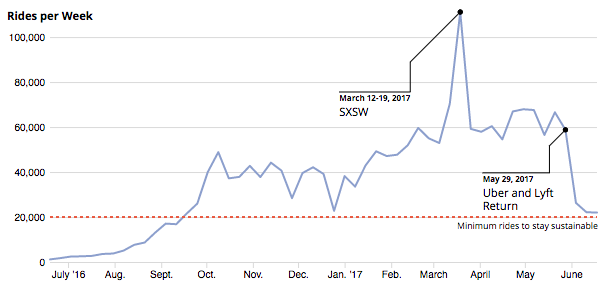
RideAustin Ridership
Texas Tribune Analyzed, visualized, and annotated RideAustin's ridership numbers before and after Uber and Lyft came back to Austin.
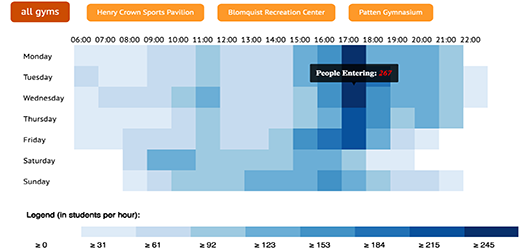
When should you go to the gym?
NBN An interactive look at the busiest times to go to Northwestern's gyms.
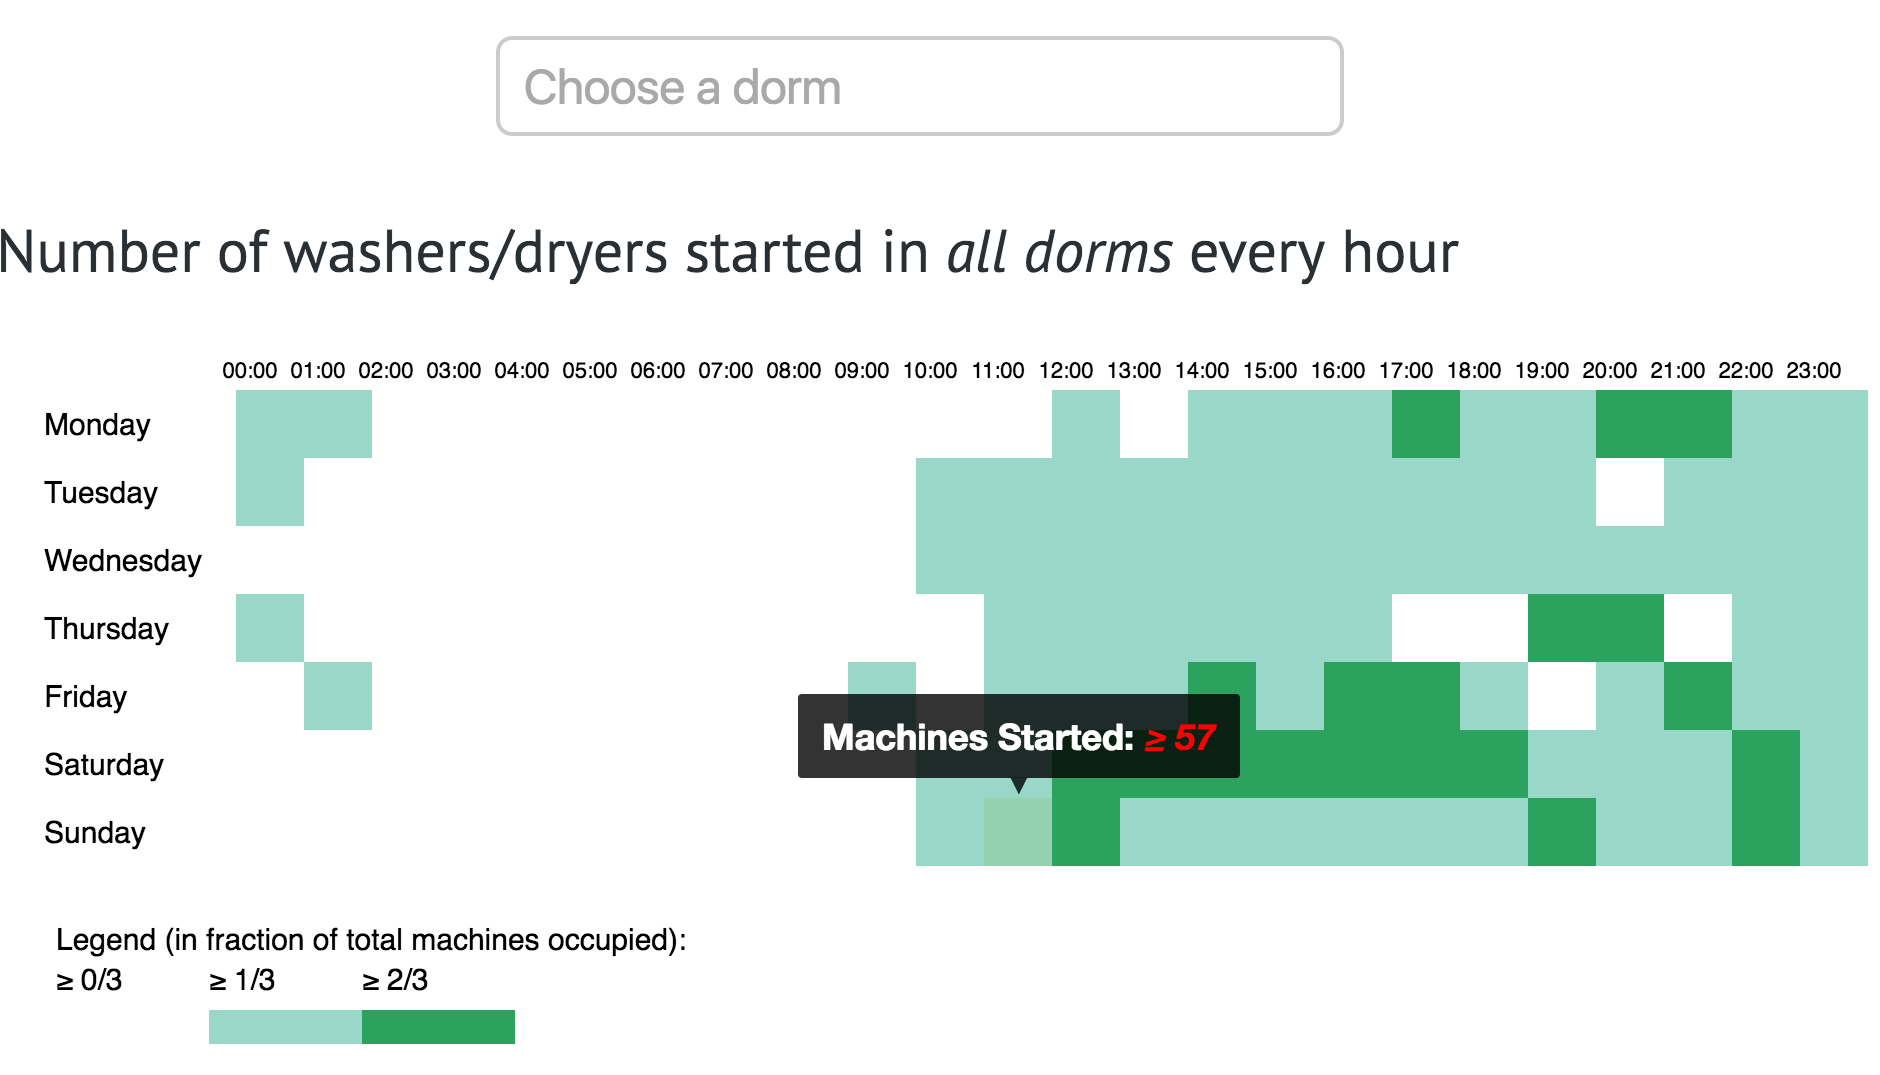
When should you do laundry?
NBN Take two of visualizing Northwestern's busiest facilities - this time, the laundry machines. I used a Python scraper to retrieve the data from LaundryView, then built the visualization with d3.
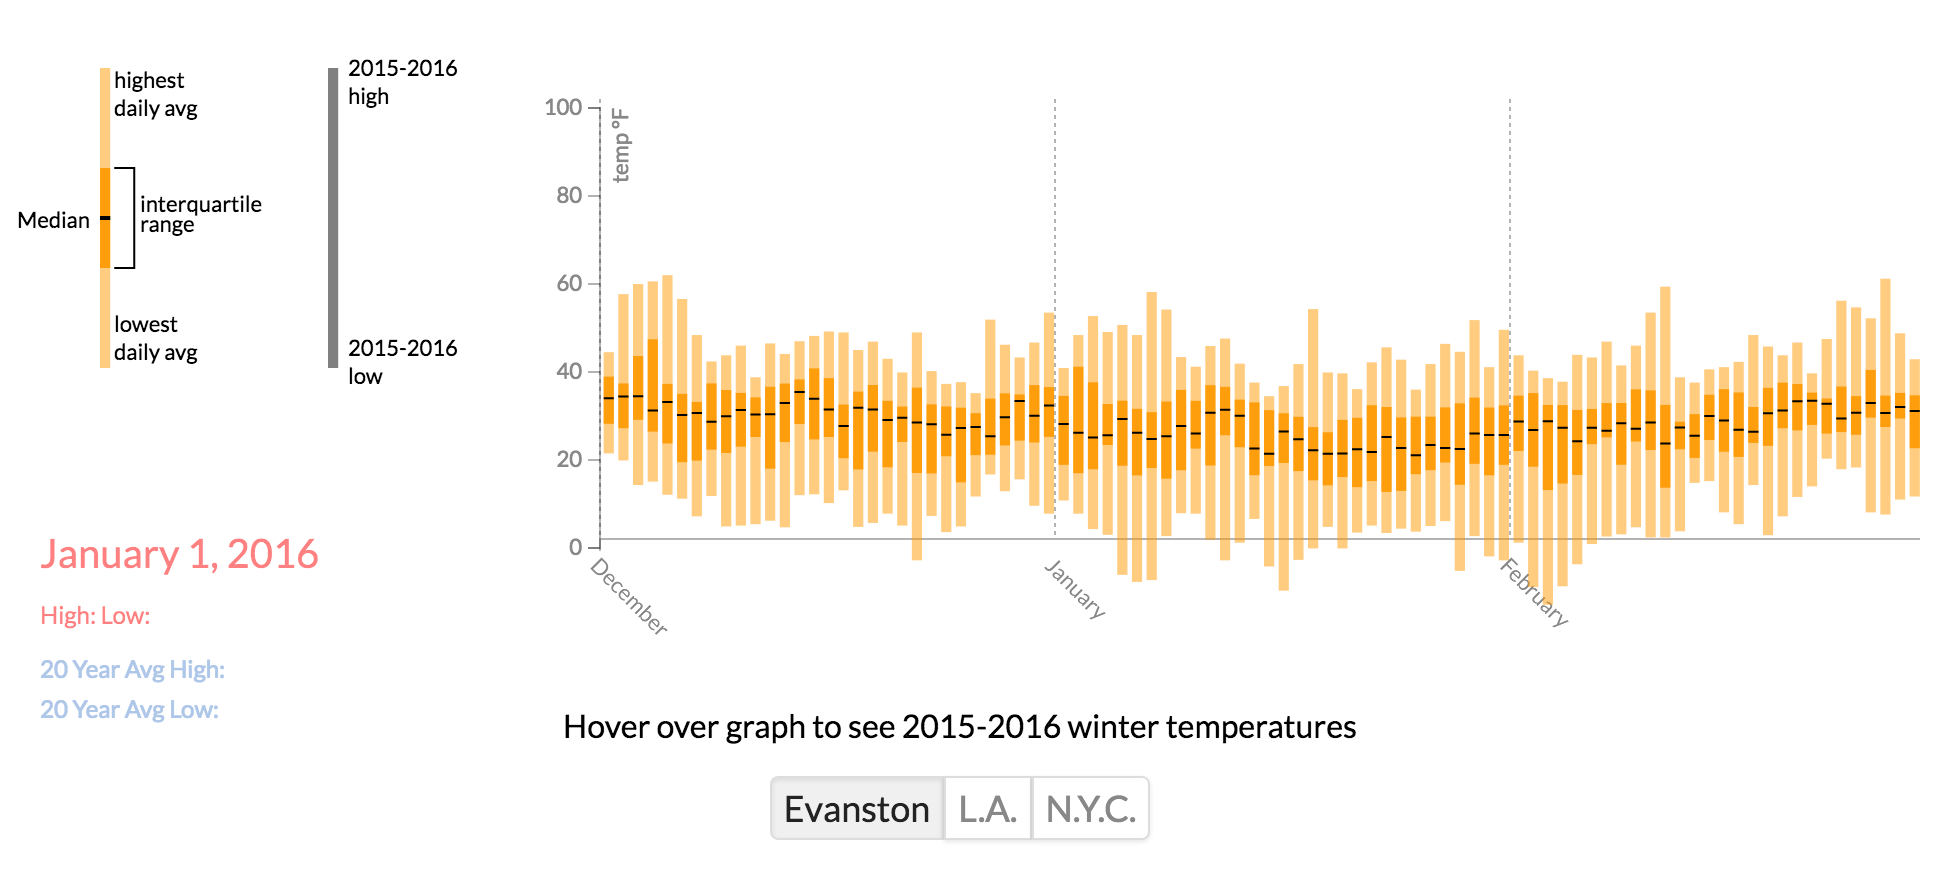
Winter weather recap
NBN A glance at an unusually warm weather in Evanston. I gathered weather data from the National Weather Service, and visualized it in d3.
Tracking the transfers
NBN A chord-diagram visualization of Northwestern's interschool transfers. The data and idea was provided by another NBN staffer, and I created the visualization.